Memory: Quantifying daily experience through 10 second POV’s
Exploring my second idea, to collect my Points-of-View, from my Snapchat Spectacle.
What dataset is being generated from multiple 10 second clips of my day for 30 days?
The Big Picture:
As I am researching on privacy and personal data, the biggest takeaway is really self-awareness, understanding what datasets can emerge as I capture my day to day activities.
Setting up parameters:
- Public facing activity – Setting up safety measures what if there are things that I don’t want to share?
- What are the interesting outcomes? What new datasets were formed?
- Identify consistencies or patterns to determine what triggers the recording.
- Identify moments when I am inspired by a view, count how many times
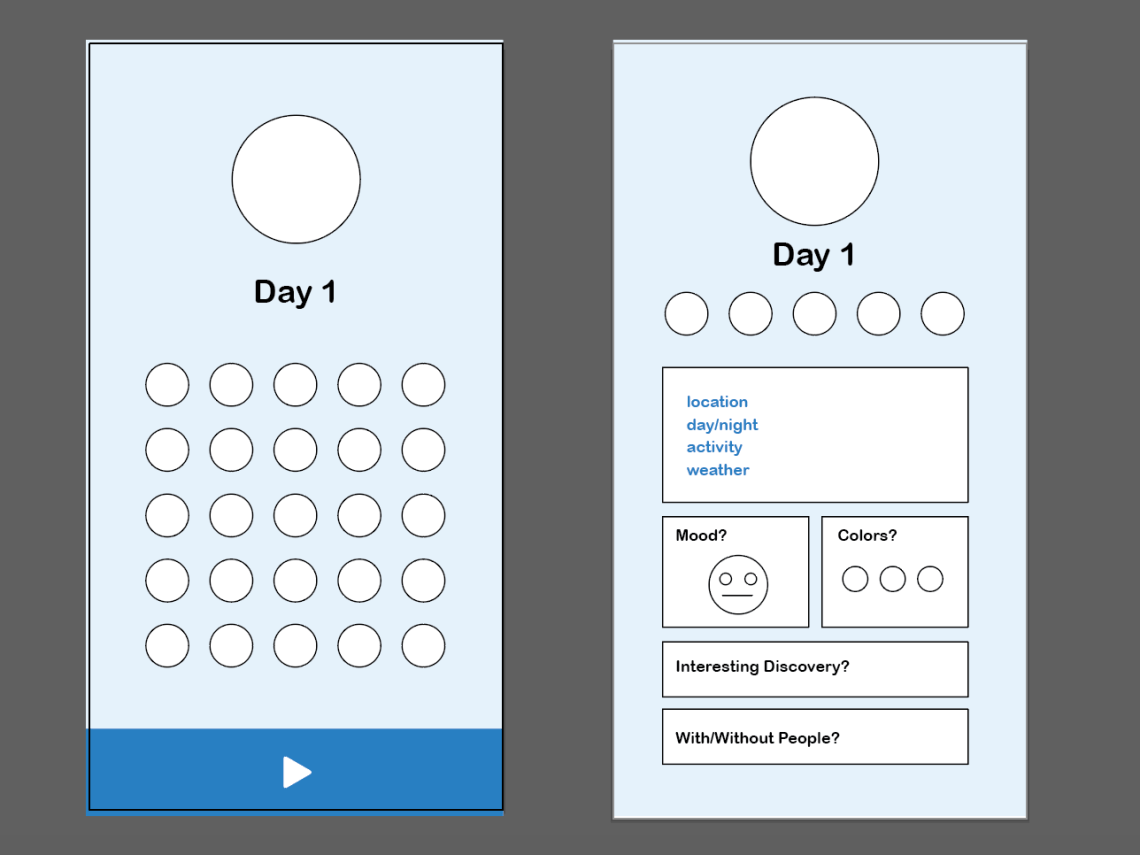
Using Spectacles, take a video of what I see and identify what dataset is collected:
- location
- activity
- weather
- mood
Will visual datasets that reveal biases in activity?
- People I meet with
- Time spent where?
- Products bought
Inspiration:
In Search of Lost Time – Art/Madeline Moment by Marcel Proust
Visualization ideas:
- Work with the video pixel or color schemes?
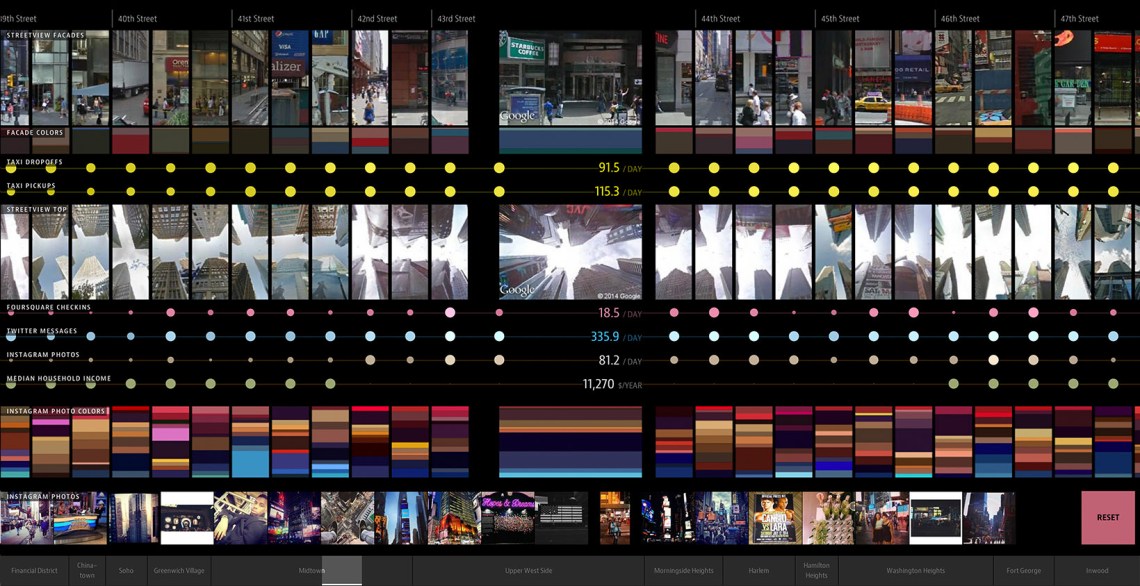
- Inspired by Daniel Goddemeyer’s “On Broadway“ which is an interactive installation that represents life in the 21st century city through a compilation of images and data collected along the 13 miles of Broadway that span Manhattan.

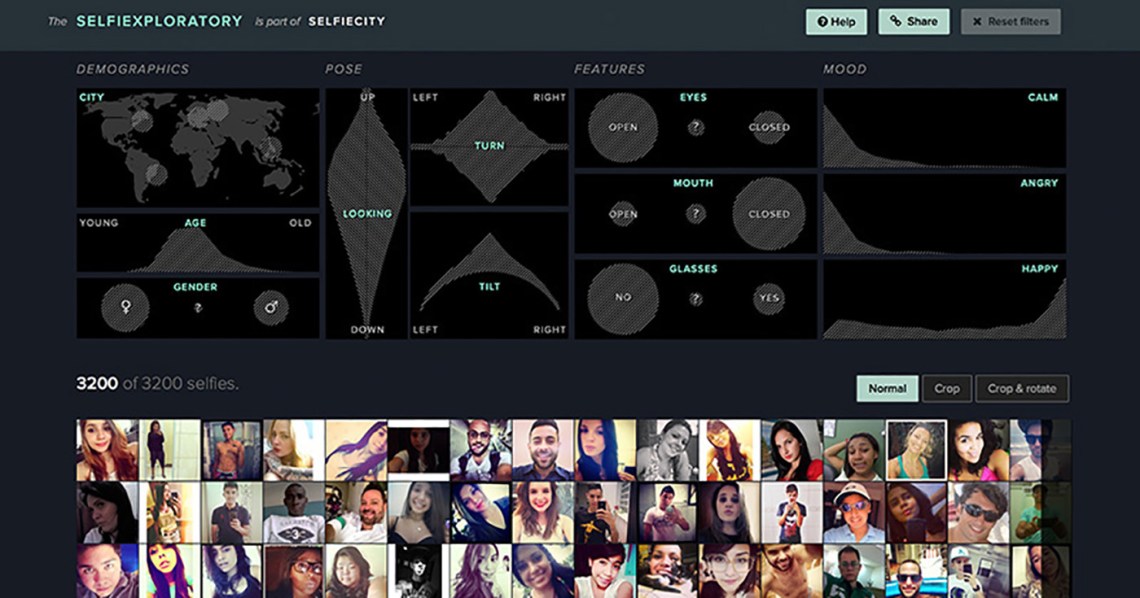
- I really love Selfie City’s Datapoints:
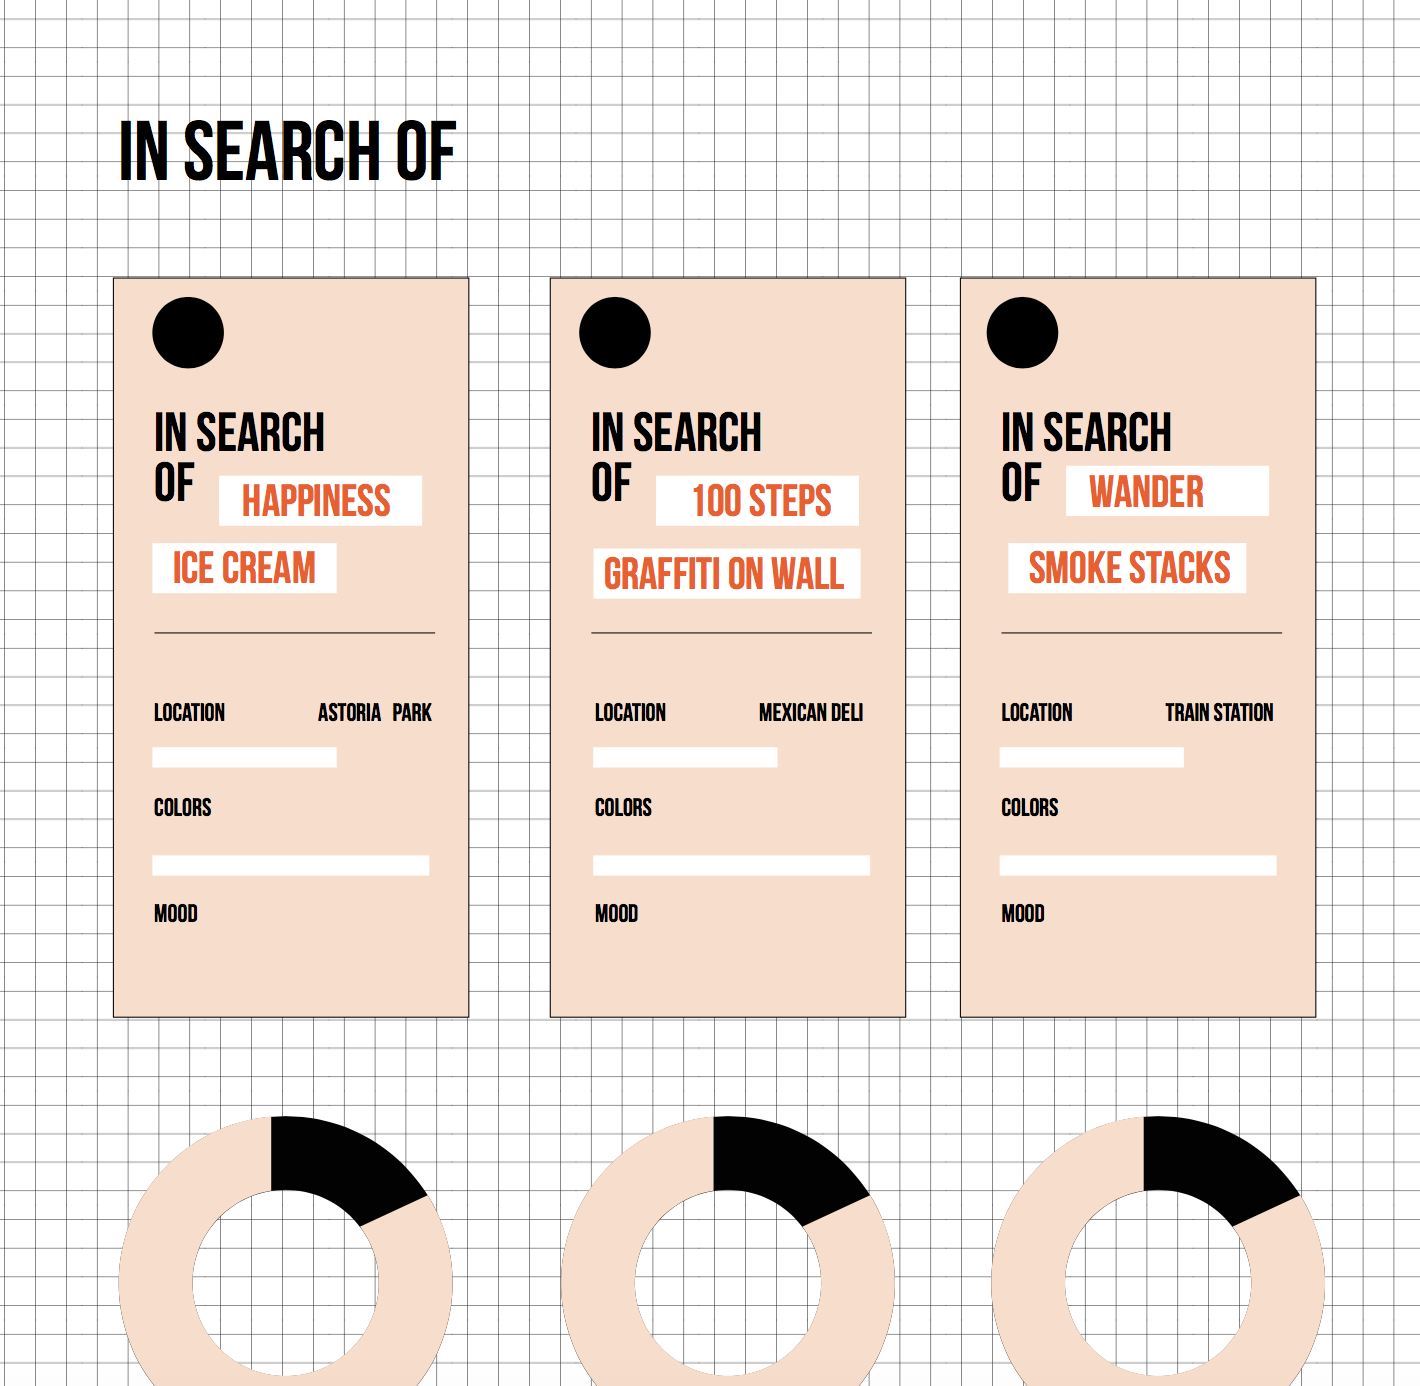
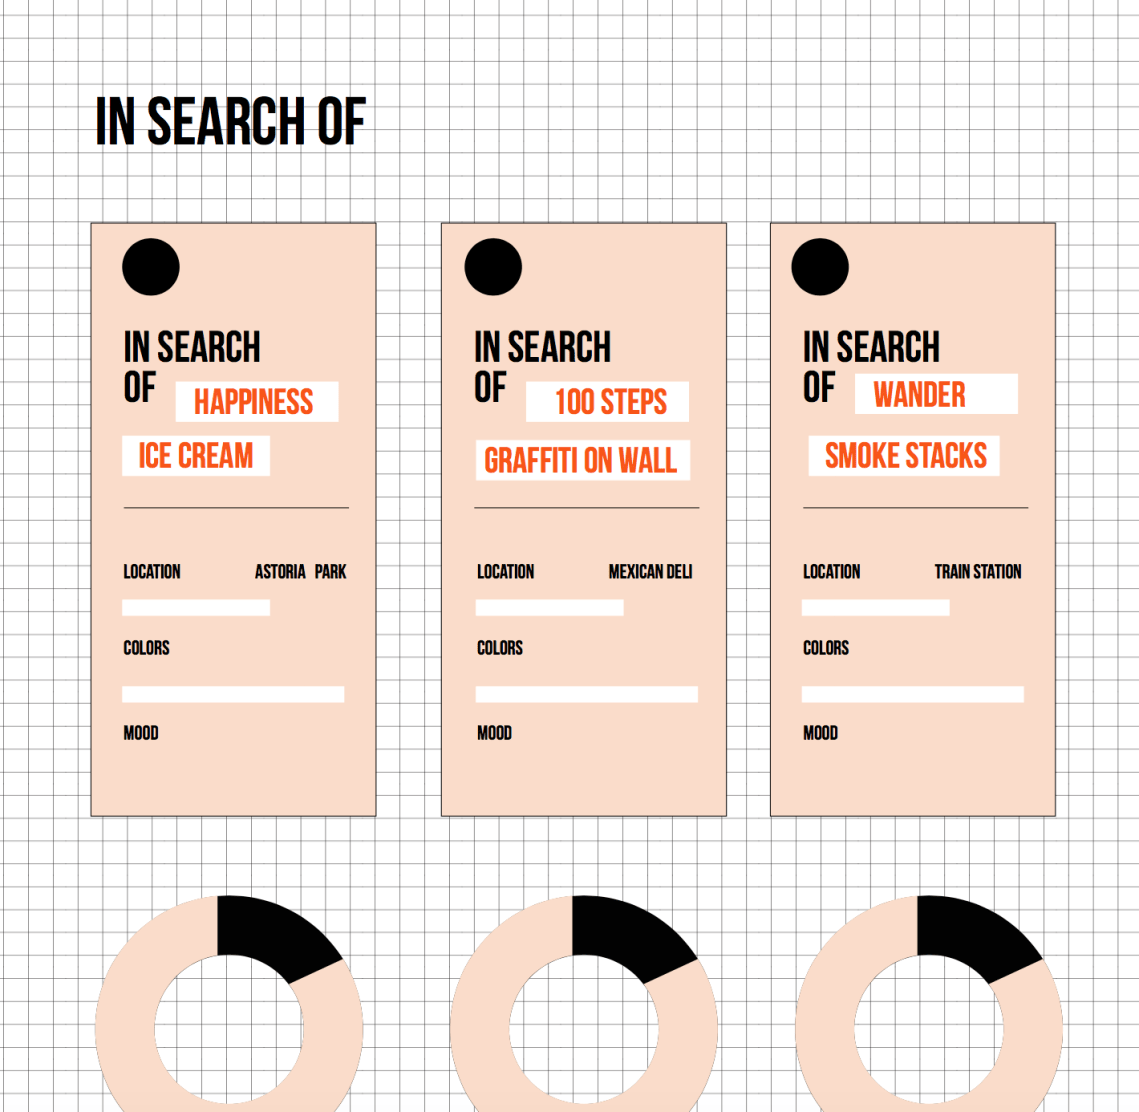
Update: Started using Spectacles and recording observations bit.ly/KriziaSpecs
| DAY 1 |
| A nice view triggered philosophical thoughts |
| Captured for memory: In class I did a real life screenshot of what I see |
| Spectacles is a conversation starter = made more friends |
| It doesn’t disturb many people that I have a camera and take videos |
Visualization Sketch: